

What is COVID-19's R number – and why does it matter? | World Economic Forum (weforum.org)
COVID-19: what is the R number?
08 May 2020
Peter BeechWorld Economic Forum writer,
- The R number is a key factor in gauging the coronavirus pandemic.
- It refers to the 'effective reproduction number' of COVID-19.
- An R value of 1 is a crucial threshold.
In just a few short weeks, we’ve all made the collective journey from pandemic ignoramuses to budding armchair virologists with a decent grasp of once-arcane terms like personal protective equipment, social distancing and "flatten the curve".
But there’s one phrase that might still leave a few justifiably scratching their heads: the R number. The coronavirus has one, and governments around the world are keen to see it shrink as much as possible. But what is it?
R refers to the “effective reproduction number” and, basically put, it’s a way of measuring an infectious disease’s capacity to spread. The R number signifies the average number of people that one infected person will pass the virus to.
The R number isn’t fixed, but can be affected by a range of factors, including not just how infectious a disease is but how it develops over time, how a population behaves, and any immunity already possessed thanks to infection or vaccination. Location is also important: a densely populated city is likely to have a higher R than a sparsely peopled rural area.
Because Sars-CoV-2 – to give the novel coronavirus its full honorific – is a new pathogen, scientists at the start of the outbreak were scrambling to calculate its R0, or “R nought”: the virus’s transmission among a population that has no immunity. Studies on early cases in China indicated it was between 2 and 2.5; more recent estimates have placed it as high as 6.6.
To put these figure in context, says Wired science editor Matt Reynolds, they're worse than seasonal flu, which has an R0 of 1.3, but miles better than measles, whose R0 is between 12 and 18. The kicker, though, is that for each of those diseases we have a vaccine, and so the effective reproduction number – the R – is way below 1.
Why do we need an R of less than 1?
This threshold – an R of 1 – will become increasingly crucial over the next few months. As the UK government explained in the video that accompanied its press briefing on 30 April, an R figure that is even slightly over 1 can lead quickly to a large number of cases thanks to exponential growth.
Here's how that works. Say a disease has an R of 1.5. This may seem like a manageable figure, but a glance at the figures quickly proves that isn't the case. An R of 1.5 would see 100 people infect 150, who would in turn infect 225, who would infect 338. In three rounds of infection, the number of people with the virus would have more than quadrupled to 557. As worldwide cases now exceed 3.5 million, this helps explain why the novel coronavirus was able to rip so quickly among a global population with no previous immunity.
Conversely, an R of less than 1 means that the virus will eventually peter out – the lower the R, the more quickly this will happen. An R of 0.5 means that 100 people would infect only 50, who would infect 25, who would infect 13. As the number of cases drops and ill people either die or recover, the virus will be brought under control – as long as the R can be kept low.
The ongoing battle to reduce R
So an R of 1 and above tends towards exponential growth. An R of below 1 tends towards the end of the outbreak. All we need to do is keep the R below 1. Simple, right?
Not so fast. As stated above, the R value is ever-changing. Thanks to lockdown measures, many governments have been able to push R to below 1. In the UK, chief scientific officer Patrick Vallence said that the nation’s R number is currently thought to be between 0.6 and 0.9, though it varies regionally and in London could be as low as 0.5 to 0.7.
This was only achieved, however, thanks to a heroic, unprecedented series of adjustments which have brought our lives and our economies to a juddering halt – and all of this to produce an R of 0.6 to 0.9. This doesn’t give us a huge amount of leeway.
Lockdown helped drop Germany’s R down to about 0.7 in early April, but researchers at the Robert Koch Institute in Berlin said it had recently increased back to 0.9, before sinking again to 0.75. Even within lockdown, if people start losing patience with restrictions or need to go out to work, R could quickly rise again.
Another difficulty that scientists and policymakers are facing is that it’s still not entirely clear how much of a role each measure plays. Is shutting schools doing the heavy lifting, or restricting access to shops? How much of a boost could wearing masks provide?
As governments tentatively ease lockdown restrictions around the world, they will be monitoring R very carefully for signs of a sudden jump. If R sneaks above 1 even a fraction, it could trigger a damaging second wave of the virus.
Once R is consistently low and the number of cases is manageable, governments can implement more precise measures to restrict R, such as contact-tracing and location-tracking apps – approaches that paid dividends when introduced early on in nations such as South Korea and Singapore.
Measuring R
There are a number of ways to calculate R, as Wired notes. One is by monitoring hospitalisation and death figures to get a sense of how many people have the virus – but the problem with this is that, since the virus’s incubation period is so long, it only gives an accurate picture of a few weeks ago. To check transmission rates in a more accurate way, scientists at Imperial College London in the UK have started testing randomised 25,000 groups of the population to see how many are ill.
It’s important to note that R isn’t the only key measure in assessing the impact of this pathogen, says the BBC. Another crucial yardstick is the number of cases of COVID-19, the disease caused by Sars-CoV-2. If we have a large number of cases and an R of 1 or just below, that still equates to a large number of infections – so ideally we need to restrict both R and bring down the number of cases at the same time.
An additional key measure to look out for is the number of ICU beds available in any given country, since this will have a big effect on mortality rate.
Ultimately, the best weapon in the fight to reduce R is a vaccine. But exactly when this will be available – or indeed if it will ever happen at all – is currently unclear.
II.
United States - COVID-19 Overview - Johns Hopkins (jhu.edu)
III.
U.S. Coronavirus Transmission Rate: These States Have the Highest R Number (newsweek.com)
U.S. Coronavirus Transmission Rate: These States Have the Highest R Number
BY SOO KIM ON 6/24/20 AT 10:15 AM EDT
s cases of the novel coronavirus in the U.S. continue to emerge, the outbreak is expected to "spread quickly" in at least 10 states, according to an analysis by the website Rt.live of each state's reproduction number (the "R number"), the number of people that one infected person will pass the virus on to, on average.
The R number, officially called the basic reproduction number (R0) or the basic reproduction ratio/rate, is a metric used to describe the contagiousness of an infectious disease, according to the Centers for Disease Control and Prevention (CDC).
When the R number of an outbreak in any given region is measured to be greater than one, the outbreak is expected to continue, while it is expected to end if the R number has a value of less than one, the CDC explains.
The R number is "nearly always estimated retrospectively from seroepidemiologic data or by using theoretical mathematical models," because sufficient data collection systems are rarely in place at the early stage of an outbreak when the R number can be measured most accurately, the CDC notes.
Rt.live aims to provide "a real-time view into the best guess for Rt [R number]," by searching for "the most likely curve of Rt that produced the new cases per day that we observe," the website states.
"Values over 1 mean we should expect more cases in that area, values under 1 mean we should expect fewer," Rt.live explains.
The company also notes that "a high Rt is manageable in the very short run as long as there are not many people sick to begin with. Smaller states like Vermont or Alaska often see
Even if there is only one person sick and that one person infects six people, Rt will be 6.0. So to evaluate how bad a situation is for a given state, you need to understand both Rt, but also the absolute number of cases," the website explains.
The case count data used in the analysis by Rt.live was taken from The COVID Tracking Project, a volunteer organization launched from The Atlantic dedicated to collecting and publishing available data on the U.S. COVID-19 outbreak. The COVID Tracking Project states that "almost all of the data we compile is taken directly from the websites of local or state/territory public health authorities.
"Where data is missing from these websites, we supplement available numbers with information from official press conferences with governors or public health authorities."
Speaking to Newsweek, a spokesperson from Johns Hopkins University (which has been widely used for citing virus figures from across the globe), Douglas J. Donovan, said: "The Johns Hopkins dashboard updates far more frequently than government websites. The Hopkins map updates approximately every 30 minutes while government websites typically update once or twice a day. Therefore, any county level data flowing into our count will appear on the Hopkins map before it appears in the official state report."
WHO Warns of 'New, Dangerous' Pandemic Phase as Case Counts Break Records
READ MORE
WHO Warns of 'New, Dangerous' Pandemic Phase as Case Counts Break Records
Speaking to Newsweek, Alice Goldfarb, who compiles data for the The COVID Tracking Project, when asked whether case data reported by The COVID Tracking Project was more accurate than (if not just as accurate) the data reported by Johns Hopkins University, said: "Accuracy depends not only on the data, but on the ways that different data categories are defined. Different states are not all reporting what a case is in the same way," referring to a blog post last week by the project discussing the reporting of probable cases.
The blog post said: "At The COVID Tracking Project, our 'cases' metric currently includes both lab-confirmed and probable cases in a single figure, but we've been internally tracking probable cases separately for states that publish them."
Goldfarb told Newsweek: "I don't know what all of the JHU [Johns Hopkins University] sources are," noting that the university "doesn't give sources for every state or territory."
"Without knowing their [Johns Hopkins University] approach in more detail, it's hard for me to compare," she said.
Rt.live is not an official website of any federal, state or city health department. It is an independent website built using publicly available data about the outbreak. See further below for more information about the website.
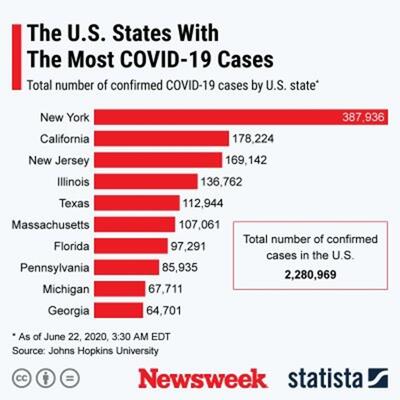
Here we look at the states where the latest reported R number is above 1.2, according to analysis by Rt.live. Confirmed case data listed for each state below is taken from the latest report Wednesday from Johns Hopkins University.
Hawaii
R number: 1.57
Confirmed cases: 819
Hawaii was reported to have the highest R number in the country. The R number in Hawaii jumped above a value of one from May 11.
Hawaii is in the third stage of the state's five-phase reopening plan. The state's "safer at home" order has been extended to the end of June. Some businesses, including bars, indoor attractions and fitness facilities, were approved to enter the first phase of reopening on June 19.
Montana
R number: 1.54
Confirmed cases: 743
Montana's R number began to surpass a value of one from May 7. The state's stay-at-home order expired on April 25. On June 1, when the state entered its second phase of reopening, the R number was estimated to be at 1.43.
The second phase permitted restaurants, bars, gyms and some other venues to open at 75 percent capacity. Gatherings of 50 or more people are banned if social distancing can't be maintained among individuals.
Nevada
R number: 1.5
Confirmed cases: 13,528
The R number in Nevada surpassed a value of one from May 17, a couple of days after its stay-at-home order expired on May 15. The state is in its second phase of reopening, with bars, gyms, spas and other businesses reopened with restrictions. Gaming establishments resumed from June 4, while the third phase is targeted for June 30, the Nevada state government confirms.
Oklahoma
R number: 1.47
Confirmed cases: 11,031
Oklahoma's R number climbed past a value of one from May 14. The state's stay-at-home order was extended to May 6. Some businesses were allowed to reopen from April 24 with restrictions, including dining and entertainment venues and personal care services.
Florida
R number: 1.39
Confirmed cases: 103,503
Florida's R number surpassed a value of one from May 11. All Florida counties entered phase one of reopening on May 18. The state began the second phase of reopening on June 5, which saw bars, pubs, personal service businesses, and entertainment businesses reopen with social distancing guidelines and capacity limits.
South Carolina
R number: 1.38
Confirmed cases: 26,572
South Carolina's R number climbed past a value of one from May 7. Several businesses and beaches were reopened from late April with safety guidelines in place. When the stay-at-home order was lifted on May 4, state parks, restaurants and hotels resumed operations. Museums, aquariums, water parks and other attractions resumed from May 22.
Wyoming
R number: 1.33
Confirmed cases: 1,254
The R number in Wyoming surpassed a value of one from May 21, nearly three weeks after the state began reopening.
An official stay-at-home order was not issued in Wyoming but from March 25 residents were advised to remain at home whenever possible, while various public venues and businesses were shut.
From May 1, several facilities were reopened with restrictions, including gyms, barber shops, hair salons and other personal care services. From June 1, outdoor gatherings of up to 250 were allowed. From mid-June, indoor gatherings of up to 250 were permitted, allowing schools to resume in-person instruction.
Oregon
R number: 1.31
Confirmed cases: 7,274
Oregon's R number went past a value of one from May 14. Last month, an executive order for the closure of schools, non-essential businesses and a ban on dine-in services at restaurants and bars was extended until July 6. A handful of Oregon counties were approved for restrictions to be eased from around May 16.
Earlier this month the state government announced detailed guidance for phase two of Oregon's reopening. Various venues were reopened but with restrictions, including social distancing requirements and a limit on indoor gatherings to 50 people.
Missouri
R number: 1.24
Confirmed cases: 19,005
Missouri's R number surpassed a value of one from May 20, just over two weeks after the state began reopening on May 4.
Missouri Gov. Mike Parson noted last month: "We are successfully flattening the curve. With the help of all Missourians, our plan is working. The health care system is not overwhelmed and we are winning the battle."
He also noted that the decision to reopen the economy and allow social gatherings was made with approval from state health officials and based on data over the past few months.
Arizona
R number: 1.23
Confirmed cases: 58,378
Arizona's R number jumped above a value of one from May 9. The state's stay-at-home order expired on May 15 but a selection of venues were reopened before the expiration of the order. Restaurants, gyms, pools, hair and nail salons, non-essential retailers were allowed to reopen with restrictions in place before May 15.
How is the R number determined?
Various data relating to the outbreak in a given population, such as the number of people who test positive, hospitalizations, intensive care unit (ICU) admissions and deaths, is collected to estimate the R number.
As infection data is based on symptomatic cases, it should be noted that it can take two to three weeks for changes in the R number to be reflected in these data sources, because of lag in time between infection and being admitted to hospital.
In 6 of the States With Spiking Coronavirus Cases, Masks Are Optional
Data on contact patterns among individuals collected through surveys can also be used to estimate the R number. But this source of data can be biased due to its reliance on self-reported information.
Different mathematical models use a selection of the aforementioned data to calculate the R number, which can vary by the model.
Rt.live estimates the R number based on testing data. "A state that has increased testing rapidly will also show an increase in the number of cases each day because they are sampling a larger portion of the population. Our model corrects for increases in testing volume and therefore shows the 'true' Rt," the website states.
"In general, hospitalizations and deaths are more reliable than tests to see the true Rt curve. However, they are also both time-shifted fairly dramatically from the time of infection. As of this time we have not included them in our model, but we are considering ways to reliably and accurately include them to ensure the model is as accurate as possible," the website adds.
About Rt.live
Rt.live was created by Kevin Systrom and Mike Krieger, the co-founders of Instagram, and Tom Vladeck, a data scientist and owner of Gradient Metrics.
"This project is not affiliated with either Instagram or Gradient Metrics...we have no intention of commercializing the site or the output of the site...we believe the public and policymakers alike should have free access to inform their decisions," the website states.
"When we started this site, we believed that a series of interventions and relaxations of those interventions at a state level would cause traditional models to struggle to explain the situation.
"Instead, we focused on providing a real-time view into the best guess for Rt, which we believe is the best metric to understand the relative growth or decline of the virus," the website explains.
The graphics below, provided by Statista, illustrate the spread of COVID-19 in the U.S. and the worst-affected countries.
1 of 3
The graphic below, provided by Statista, illustrations the daily number of newly confirmed COVID-19 cases in the U.S.
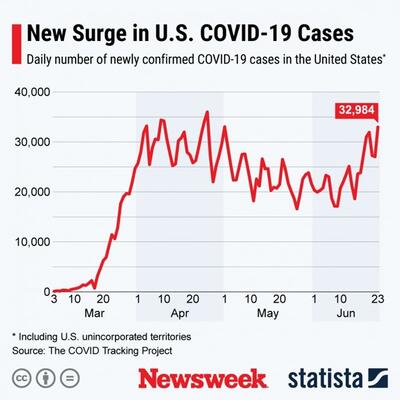
The number of newly confirmed COVID-19 cases in the U.S.STATISTA
The graphic below, provided by Statista, illustrates the percentage of COVID-19-related hospitalizations, ICU admissions and deaths in the U.S.
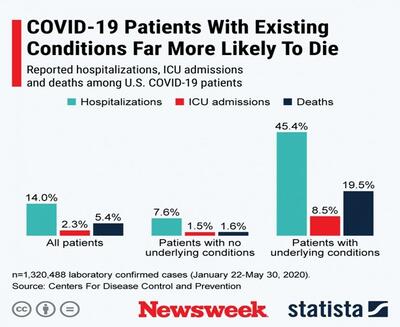
Hospitalizations, ICU admissions and deaths among U.S. COVID-19 patients.STATISTA
IV.
Why 'Exponential Growth' Is So Scary For The COVID-19 Coronavirus (velandymanoharmd.com)
Why 'Exponential Growth' Is So Scary For The COVID-19 Coronavirus
Ethan Siegel Senior Contributor
The Universe is out there, waiting for you to discover it.
In any biological system, if you put a living organism into an environment where it can thrive, with unlimited resources and no predators or competitors, it will always grow in the same fashion: exponentially. As long as those conditions are met, everything from wolves to parasitic wasps to yeast cells will grow exponentially, up until one of those assumptions fails to be true. Only at that point will growth become slower, and that holds the key to understanding how to mitigate the present pandemic.
In the case of the coronavirus COVID-19, exponential growth will occur in the disease rate in humans so long as:
- there is at least one infected person in the population pool
- regular contact between infected and uninfected members of the population occurs
- and there are large numbers of uninfected potential hosts among the population.
That's why it's so deadly…